Matrigel Mattress: A Method for the Generation of Single Contracting Human-Induced Pluripotent Stem Cell-Derived Cardiomyocytes
Matrigel mattress system:
The lack of measurable single-cell contractility of human-induced pluripotent stem cell-derived cardiac myocytes (hiPSC-CMs) currently limits the utility of hiPSC-CMs for evaluating contractile performance for both basic research and drug discovery. Therefore, we developed a culture method that rapidly generates contracting single hiPSC-CMs and allows quantification of cell shortening with standard equipment used for studying adult CMs. We demonstrate that culturing hiPSC-CMs on Matrigel mattress for 5 to 7 days leads to relative morphological, molecular, and functional maturation, enabling robust cell shortening in a much shorter timeframe than traditional methods, such as engineered heart tissue or long-term culture. Our Matrigel mattress method enables rapid assessment of contractile properties and Ca handling at the single-cell level using standard equipment available in any laboratory studying adult primary CMs. This new method allows quantification of contractile performance at the single-cell level, which should be valuable to disease modeling, drug discovery, and preclinical cardiotoxicity testing.
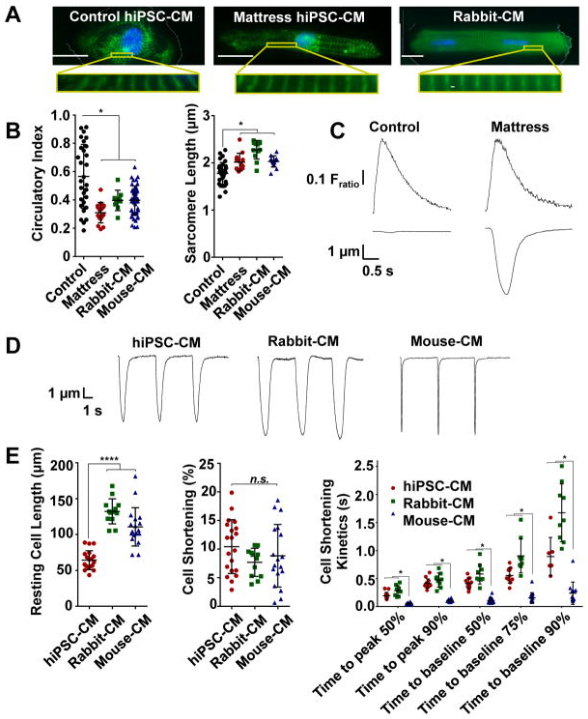
Figure 1. Matrigel mattress morphometry and contractility. A, Immunofluorescence staining of cardiac myocyte (CM) structural marker α-actinin (green) and nucleus (blue, DAPI) for control human-induced pluripotent stem cell–derived CMs (hiPSC-CMs; left), mattress hiPSC-CMs (middle), and rabbit CMs (right). Scale bar, 20 µm; magnification, ×63. B, Cell morphometry measuring circularity index (left) and sarcomere length (right) for indicated CMs; error bars, SD (n=9–48 cells per group). C, Representative control and mattress hiPSC-CM Ca transients (top) and contraction traces (bottom), spontaneously contracting. D, Representative contraction traces for indicated CMs (0.2 Hz). E, Contractility assessment measuring resting cell length (left), cell shortening (middle), and cell shortening kinetics (right); error bars, SD (n=6–20 cells per group). **** P<0.0001 vs hiPSC-CMs. *P<0.05 vs mouse CMs. n.s. indicates not significant.